Contents
A Worked Example of Interpreting a Perceptual Map
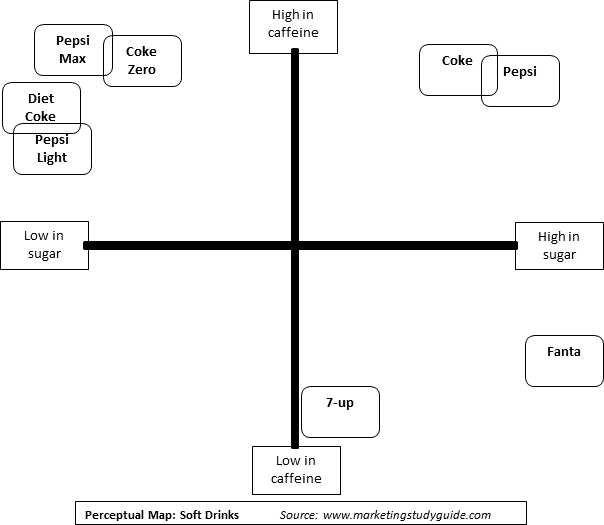
Let’s review the three perceptual maps shown in the ‘what is a perceptual map?’ section of this study guide. Using the checklist of questions , a summary of conclusions that can be drawn is provided following each map.
Please note that the perceptual maps and their interpretation are based on hypothetical data and are provided for educational purposes only and may not reflect the brand’s actual position in the marketplace.
Findings |
Review of the perceptual map |
| Matching of the major brand offerings | Coke and Pepsi products appeared to be paired together. Therefore, the market perceives these firm’s offerings as very similar across their three cola products (normal, zero/max, diet/light). |
| Distinct product positioning achieved by brands | The market perceives significant differences between the normal and the no sugar offerings under the brands of Coke and Pepsi.The market also perceives a reasonable level of difference between the firm’s two diet offerings. |
| Competitive barriers in place | Having multiple distinctive offerings (both Coke and Pepsi) in the market is a high competitive barrier (for them combined), as the firms ‘own’ significant parts of the market space.Obviously there would significant competition between the two, but they are relatively protected from other players, particularly at the top of the perceptual map. |
| Some cannibalization likely | However, there is less positioning differential in regards to the top left hand quadrant of the map. As a result, some cannibalization of sales will probably occur. |
| Several market gaps exist | The map highlights many market gaps, particularly towards the middle of the map. These are probably viable gaps and present a significant market opportunity. |
| Non-cola advantages | The two non-cola products (7-Up and Fanta) appear to be very well positioned, with both having a clear and distinct space on the map. |
| Map appears incomplete | In terms of the last two comments, it should be noted that the map appears incomplete and is missing a number of competitors. Therefore, a more complete map may result in some difference conclusions being drawn. |
| Logic check is OK | Other than the previous concern, the product positions shown on the map appear to be logical and in line with expectations. |
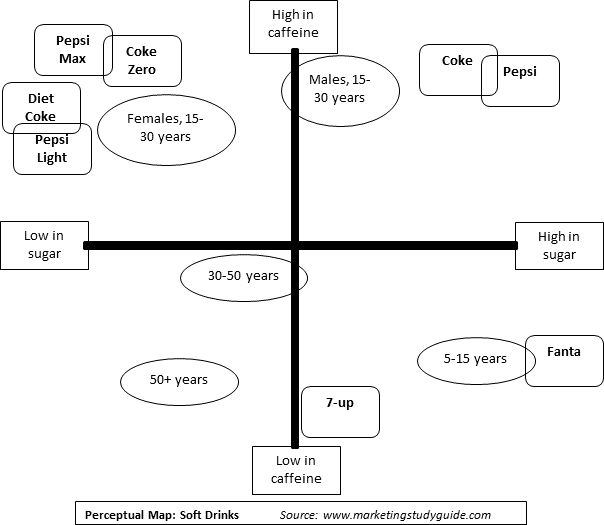
Now let’s look at the same map, this time with the consumer preferences for different target markets overlaid. Additional comments, as a result of this further information, are summarized in the table after the map.
Findings |
Review of the perceptual map |
| Gender differences | This is a market that appears to have significant needs differences between males and females, as there appears to be a stronger preference appropriate for low sugar product offerings by females. |
| Fanta well-positioned | As presented, the Fanta product is very well positioned relative to the children’s market, without any strong competitor being evident. |
| 7-Up needs a positioning improvement | While 7-Up has a clear and distinct positioning on this map, it does not appear to be directly aligned to the preference needs of any particular segment. As a result, the product may need to be repositioned closer to a target market preference. |
| Two clear market gaps | There are two distinct market gaps available that would probably present a good market opportunity, as both the 30 to 50 years and the 50+ years age group do not have product offerings that are perceived to closely meet their needs. |
Young males split |
The young male segment appears to be divided between normal Coke/Pepsi and low sugar Coke/Pepsi, resulting in their preference needs being mapped somewhere in the middle. This indicates that this target market should be further segmented. |
| Young females is a competitive segment | The most competitive segment is young females target market, which has four strong product offerings positioned close to it. |
| Caffeine need is age related | There appears to be a strong relationship between the preference/need for high caffeine and the age group (youth market has a stronger preference). |
| NOTE | These are additional comments, or clarifications, to the comments made in the previous table. You should note how the addition of the customer preference data changes the interpretation of the perceptual map. |
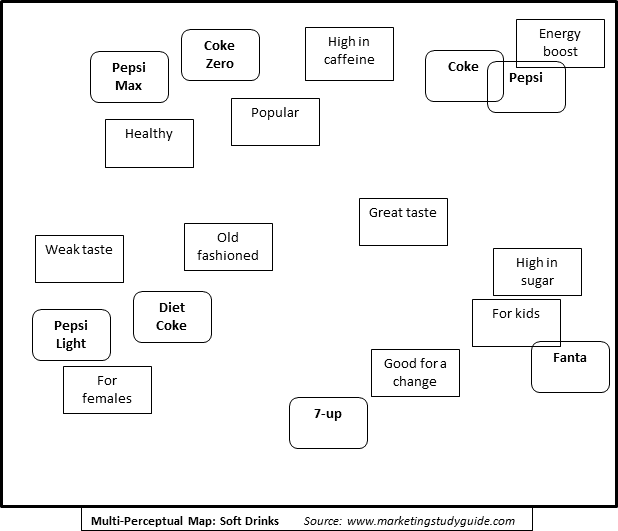
The final perceptual map below looks a more complicated, but the same review principles apply. The major difference is that there are multiple attributes listed (not just two). This creates a more complete picture of the market and consumer’s perceptions. It also gives a guide to how the consumers tend to link/connect the various product attributes.
Findings |
Review of the perceptual map |
| Head-to-head positioning | In most cases, the Coke/Pepsi products are perceived as quite similar, resulting in head-to-head competition in most cases. |
| Generally unique space | However, each product generally has its own positioning space, despite having a close competitor. |
| New products has dated existing ones | The introduction of Coke Zero and Pepsi Max appear to have had the impact of dating both Diet Coke and Pepsi Max, as they are more closely associated with ‘old-fashioned’. Likewise the 7-Up positioning is slightly associated with the ‘old-fashioned’ attribute as well. |
New products are trendy |
Coke Zero and Pepsi Max are positioned close to the attribute of popular, probably due to the fact that they are more recent products. |
| Perceived gender positioning | Pepsi Light and Diet Coke both appear to have a gender preference, being seen as more female-oriented drinks. |
| Max/Zero connected to health | Pepsi Max and Coke Zero are both seen as healthier alternatives, probably due to their low sugar perception. |
| 7-Up seen as an alternative | 7-Up is position close to “good for a change”, indicating it is an alternative choice, rather than being a preferred choice. |
| Sugar + caffeine = energy | Consumers seem to link sugar and caffeine in their minds to equal an ‘energy boost’, perhaps rivaling the substitute energy drink market at times. |
| Sugar-kids connection | There is a clear market connection between high sugar and being more appropriate to children, this is evident by Fanta’s positioning |
| Taste better for sugar | The ‘great taste’ attribute is positioned more towards the drinks with high sugar, and the ‘weak taste’ attribute is much closer to the low sugar versions. |
| Link of old-weak | Consumers have linked ‘old-fashioned’ and weak taste to some extent, which may be a longer term concern for these brands, particularly if new products are planned. |


