Please note: This article explains how to build segment profiles using Excel – but a free segmentation tree and segment profiling Excel template is available for free download on this site along with simple video instructions on how to use.
Contents
- The role of segment profiles
- What information do I need to develop a segment profile?
- Step 1: Summarize your consumer data in an Excel spreadsheet
- Step 2: Construct your segmentation tree (or trees)
- Step 3: Filter your consumer data to separate each branch of your segmentation tree
- Step 4: Build your segment profiles
- Step 5: Compare to other segments and to the average consumer
- A free Excel template for the segment profiling process
The role of segment profiles
Segment profiles are rich and deep descriptions of a firm’s target markets. We try to include as much valid and valuable information as we can, in order to “paint a clear picture” of the typical consumer in the segment.
Once a segment profile has been developed, the firm then uses this information to help construct their marketing mix activities around the segment’s unique needs, preferences and requirements. In other words, segment profiles are the basis for forming and implementing an organization’s marketing program – as marketing decisions should be based upon the needs of a target market.
You may recall from your initial marketing studies, that the marketing concept is built around understanding the needs of consumers – that is particular target markets – and developing a marketing mix of them more effectively that meets their needs more effectively than competitors.
Please see this article on examples of segment profiles for more information.
What information do I need to develop a segment profile?
An effective segment profile requires access to consumer information. There are two ways to generate this information:
- The first is from the firm’s own customer database. If you use customer database information, then you can create segment profiles of your existing customers. Obviously, this approach does not give any insight into non-customers which may also be in your target market.
However, the advantage of this approach is that the firm will typically have quite detailed information quickly available, including purchase behavior and customer value and, of course, the data is already available and free to access for the firm (provided it is in a data analysis friendly structure).
- The second source of information for segment profiles is obtained from market research survey data. While this approach is clearly more expensive than utilizing the firms own customer database, survey data is also able to provide a profile of the typical consumer in the marketplace, whether or not they an actual customer of the firm.
This is important if the company has interest in expanding its target market or reaching consumers and do not currently deal with the company – which will be generally the case for most firms.
While market research surveys are not as precise and accurate as customer database records, particularly when it comes to purchasing behavior and history, they do allow the ability to ask additional questions and gather information that would not be typically recorded in a customer database.
Please see the article on different ways to segment the market.
Step 1: Summarize your consumer data in an Excel spreadsheet
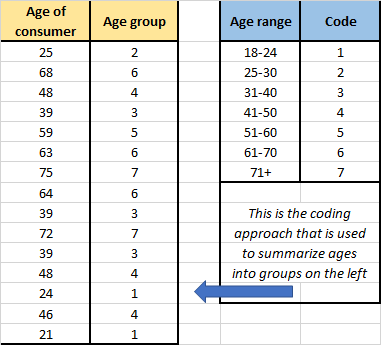 The first step in developing detailed segment profiles is to place your data into an Excel spreadsheet. Typically we need the data to be placed into a scale as this will summarize and categorize the different consumers more effectively. For example, instead of listing a consumer’s individual age, you would code the consumer into an age group as shown in the following diagram.
You will then need to enter your data into an Excel spreadsheet with the name of the segmentation variable at the top of the column and then the information for each individual consumer listed underneath.
In my example, you can see that I’m using 10 variables to describe the consumer – starting with income, then age, all the way across to a measure of of lifestyle.
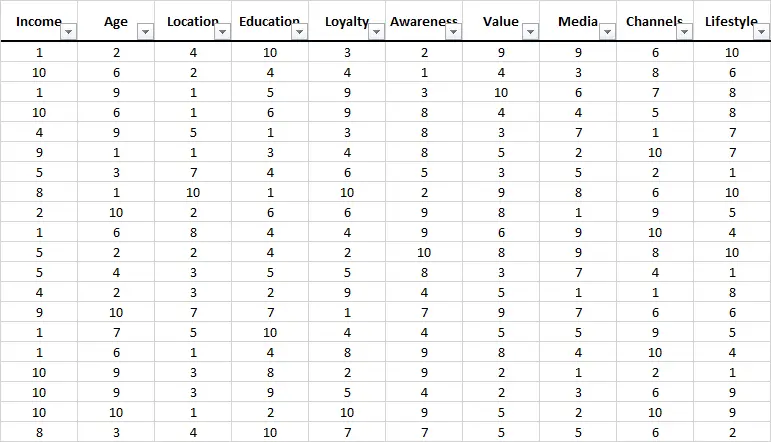 Please note that the headings that you use will relate to the aspects of the consumer information that you have available. This means that your listing of variables is most likely to be unique to your particular customer database or market research survey set.
You will also note that under each variable name there is a small triangle indicating access to a drop-down menu. This has been constructed by setting up filters on Excel once the data has been entered. This is very easy to do using the Data/Filter options menu in Excel. To set up the filter, you simply highlight all the data, then go to Data in the top menu, and then select filter in that menu.
For more information here is a link to an external site specializing in Excel (Microsoft support site).
Step 2: Construct your segmentation tree (or trees)
 To construct a segmentation tree, you need to consider which of the variables (that you have access to) would make the most sense in terms of differentiating between consumers in the marketplace.
Ideally you are looking for a final set of market segments that are relatively distinct from each other.
Generally, firms will use a trial and error approach – constructing multiple segmentation trees and looking at the end market segment profiles, before finalizing their market segmentation approach. Typically firms look for a selection of variables (segmentation bases) that have some relevance to their marketing activities, brand and/or overall value proposition.
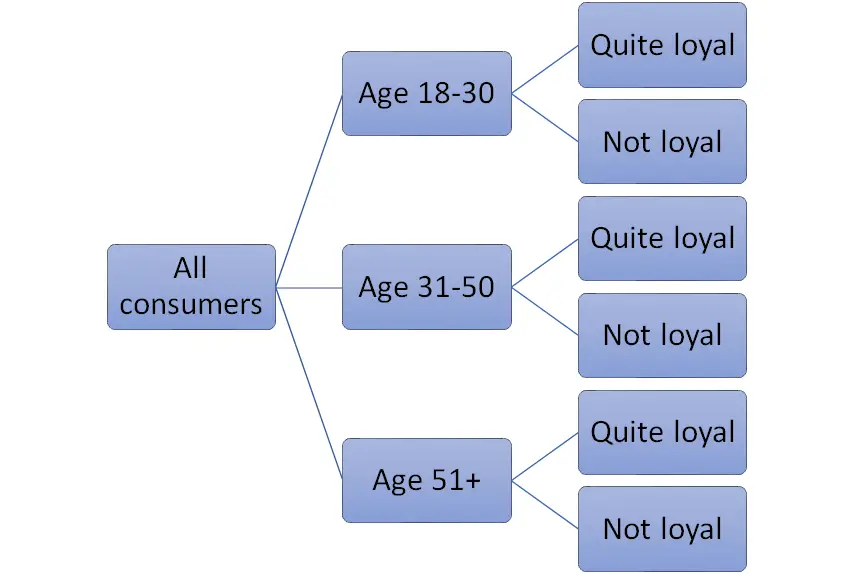
In my example, I have used three age groups and a simple measure of loyalty. As you can see, this creates six market segments. I could continue the process by adding another segmentation base, but then I would have 12 market segments. Typically large firms or brands would look at 10+ market segments, but smaller firms need to be more selective as it can become inefficient to segment the market too precisely (as quite small market segments are created).
Important note: You do not include all of your variables as segmentation bases (to construct your segmentation tree) – generally you should pick two of three relevant variables as the bases. But you will include all the variables and information when you outline the segment profiles.
Step 3: Filter your consumer data to separate each branch of your segmentation tree
 In my example segmentation tree above, the first of my six segments consists of consumers aged 18-30 years, with a high level of loyalty.
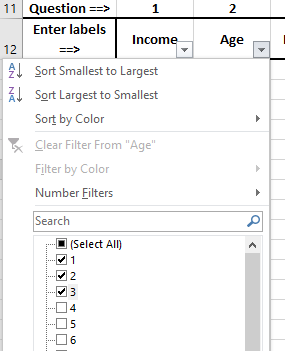
Therefore, I use the built-in functionality of Excel to select those consumers only. I click on the triangle (drop down menu) and then select the relevant age codes, as shown here.
I then repeat the same process for selecting the more loyal consumers and Excel filters out all the consumers that do not match and only the consumers that fit my segmentation base are remaining on the worksheet.
I can then copy/paste that segment’s information/data to another worksheet so I can then construct the segment profile.
I simple repeat this process for all six market segments (or how many segments that you will be using) to separate each segment’s data into its own worksheet.
Step 4: Build your segment profiles
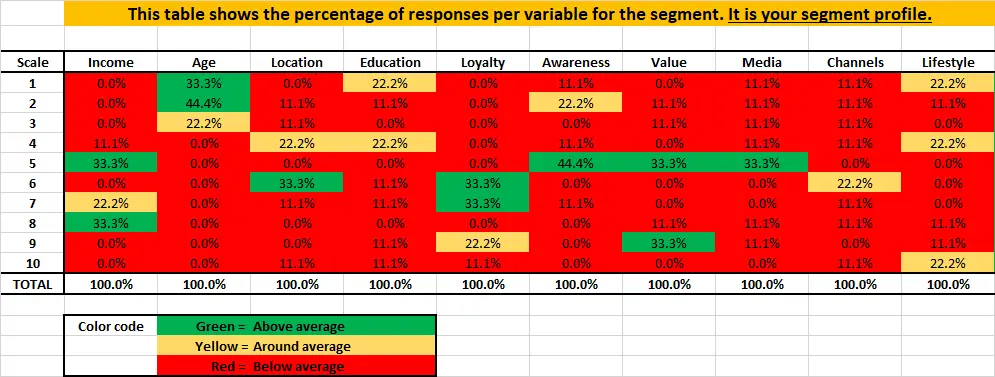
You should now have each segment’s data in a separate worksheet on your Excel file. And you can then work out the percentage of the segment’s consumers that are in each of your scaled categories, as shown in the example above.
In this case, you can see that this is the younger age group, with higher loyalty segment. I have used the built-in functionality of Excel (conditional formatting) to color code the profile to make it easier to examine. For example, this segment tends to have a good income, many come from a particular geographic location, and so on.
You will need to repeat this step for each segment and construct multiple tables like the one above.
You may want to also add graphs and even images to your final segment profiles, but your data table in Excel will be the central piece of your segment profile.
Step 5: Compare to other segments and to the average consumer
This final set in the segment profiling process is to check that your segment is distinct from the other segments and from the overall market. If this is the case, each segment profile should appear to be quite different and somewhat unique. It will also help you identity how (and perhaps why) the segments differ – which is likely to be a helpful insight into improving your marketing effectiveness.
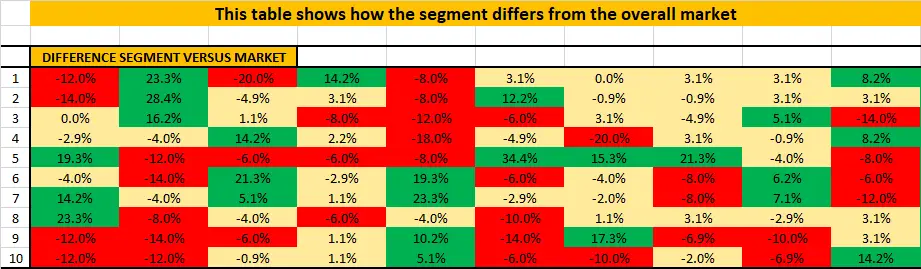
The simplest way to examine the level of distinction between the market segment and the overall market is to simply compare the percentage differences (using our scaled data). Again we can color code the output to allow fast and efficient analysis to be undertaken.
A free Excel template for the segment profiling process
Instead of working through all these step from scratch, a free template is available for download on this site.
Related articles