Contents
What is a Perceptual Map?
A perceptual map is a visual technique used by marketers to identify the positioning of their products or brands within the market, relative to their key competitors.
There are several variations of a perceptual map, but the most commonly used approach by marketers, and in marketing textbooks, a two-axis scatterplot chart, however there are also other formats (such as multi-dimensional attribute maps) that are sometimes used for deeper analysis.
Why are Perceptual Maps Used?
A perceptual map is an analytical tool used by firms for the purposes of:
- Market analysis = to help identify and understand their brand and/or product positioning in the marketplace, relative to key competitors
- Trend analysis = to track the changing consumer perception of their brand and competing brands over time
- An input into SWOT analysis = the relative positioning of their brands/products, as this is an indicator of strength or weakness in the marketplace
- Identifying competitive strategy = the competitor’s positioning, and their changing positioning over time, will usually give additional insight into their overall marketing strategy
- Greater understanding of consumers = by using a perceptual map, firms can identify the differing perceptions of the firm’s brand across different market segments
- Identifying opportunities for new products = perceptual maps can aid in the identification of “gaps” in the market, which the firm may be able to fill by developing a new product
For more information on the benefits and uses of a perceptual map, please see this article on the Benefits of Perceptual Maps.
Definition of perceptual maps
Most definitions are fairly consistent in their description of perceptual maps, as follows:
- “Perceptual maps measure the way products are positioned in the minds of consumers and show these perceptions on a graph whose axes are formed by product attributes.” (Kardes, Cronley, & Cline, 2011).
- “A perceptual map represents customer perceptions and preferences spatially by means of a visual display” (Ferrell & Hartline, 2008).
You will note that both definitions highlight that the information is visually presented on some form of graph or display. And that a perceptual map is designed to examine consumer perceptions and understanding, primarily of products and their associated positioning.
How to Make a Perceptual Map
Ideally, a perceptual map should be based upon results from a consumer survey, where respondents have been asked about their perception of competing brands. The questions need to be asked on a scale basis, such as:
On a scale of 1 to 9, where nine is “very easy to use” and one is “very hard to use”, how would you rate Brand X, then how would you rate Brand Y, and so on…
Once we have this consumer survey data, we would then construct a series of scatterplots (or bubble charts) in Excel or similar software (we will usually review many maps based on this consumer data for analysis purposes).
Here is an example of a perceptual for competing hotels for a beach holiday destination.
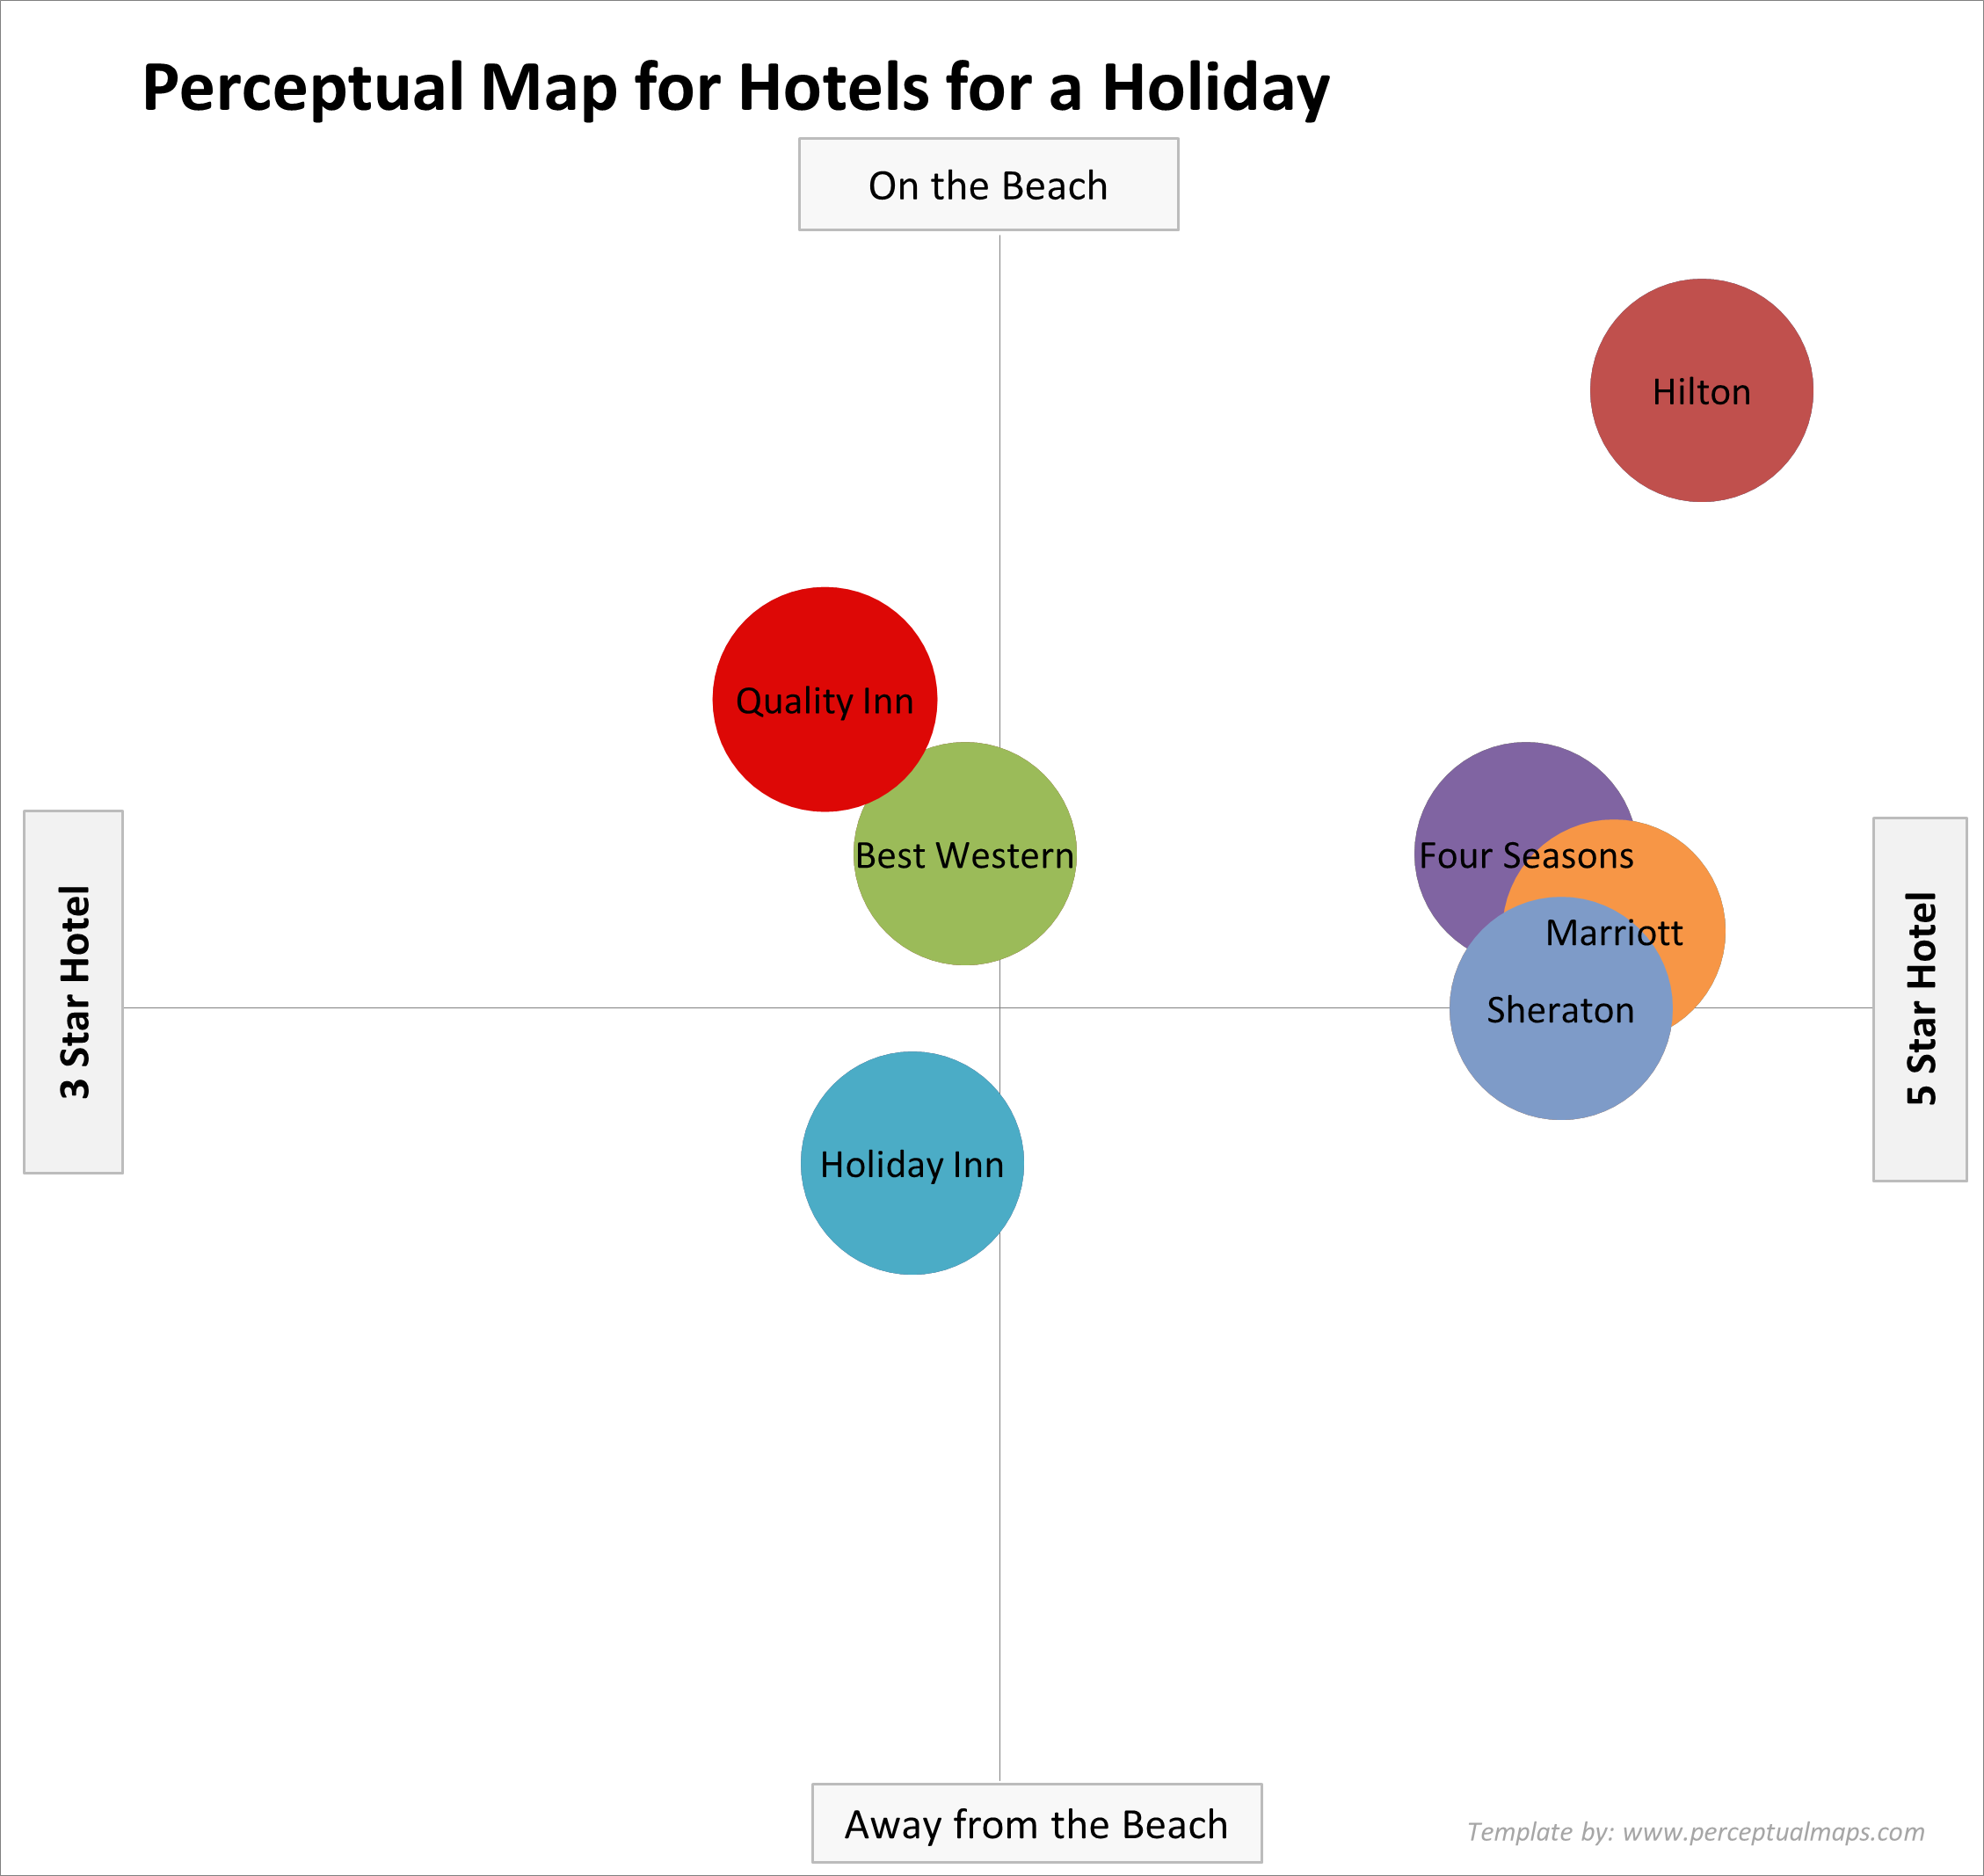
In this hotels for a holiday example, we have used two attributes = their quality level from 3 star to 5 star, and how close they are to the beach. We had then use the perceptual data that we have obtained from the consumer survey and plotted each brand.
For example, Hilton Hotels has scored 9/9 for both being perceived as a five star hotel and as being perceived as being “on the beach“. Please note that we are using the word “perceived” carefully. A key aspect of the perceptual map is that it considers the PERCEPTION of consumers, not reality.
In this example, it is possible that the star rating and the proximity to the beach may differ from the above perceptual map in real life – but that does NOT matter, as we are only interested in consumer perceptions.
The two axes on the perceptual map should represent important attributes (sometimes referred to as determinate attributes) to the consumer. This means that the consumer uses these two attributes to frame their understanding of the product/brand, which in turn will affect their likelihood of purchasing that brand relative to competition.
In this case for a holiday choice, we have used two attributes of quality and location, which are likely to be important considerations to the consumer when selecting the hotel.
Please note that the above perceptual was constructed using an Excel template that is available for free download on this website. Click here for the download… free_download_perceptual_map_template_2025_SSG
Using Perceptual Maps to Review the Perceptions of Multiple Market Segments
A perceptual map is designed to show how target market consumers understand the relative positioning of the competing products in the market.
However, we can also use these maps to analyze the perception of any market segment, or the overall market. While the perception of the overall market (that is, all consumers) is generally not helpful, comparing how different market segments perceive the brands in the market can be very insightful.
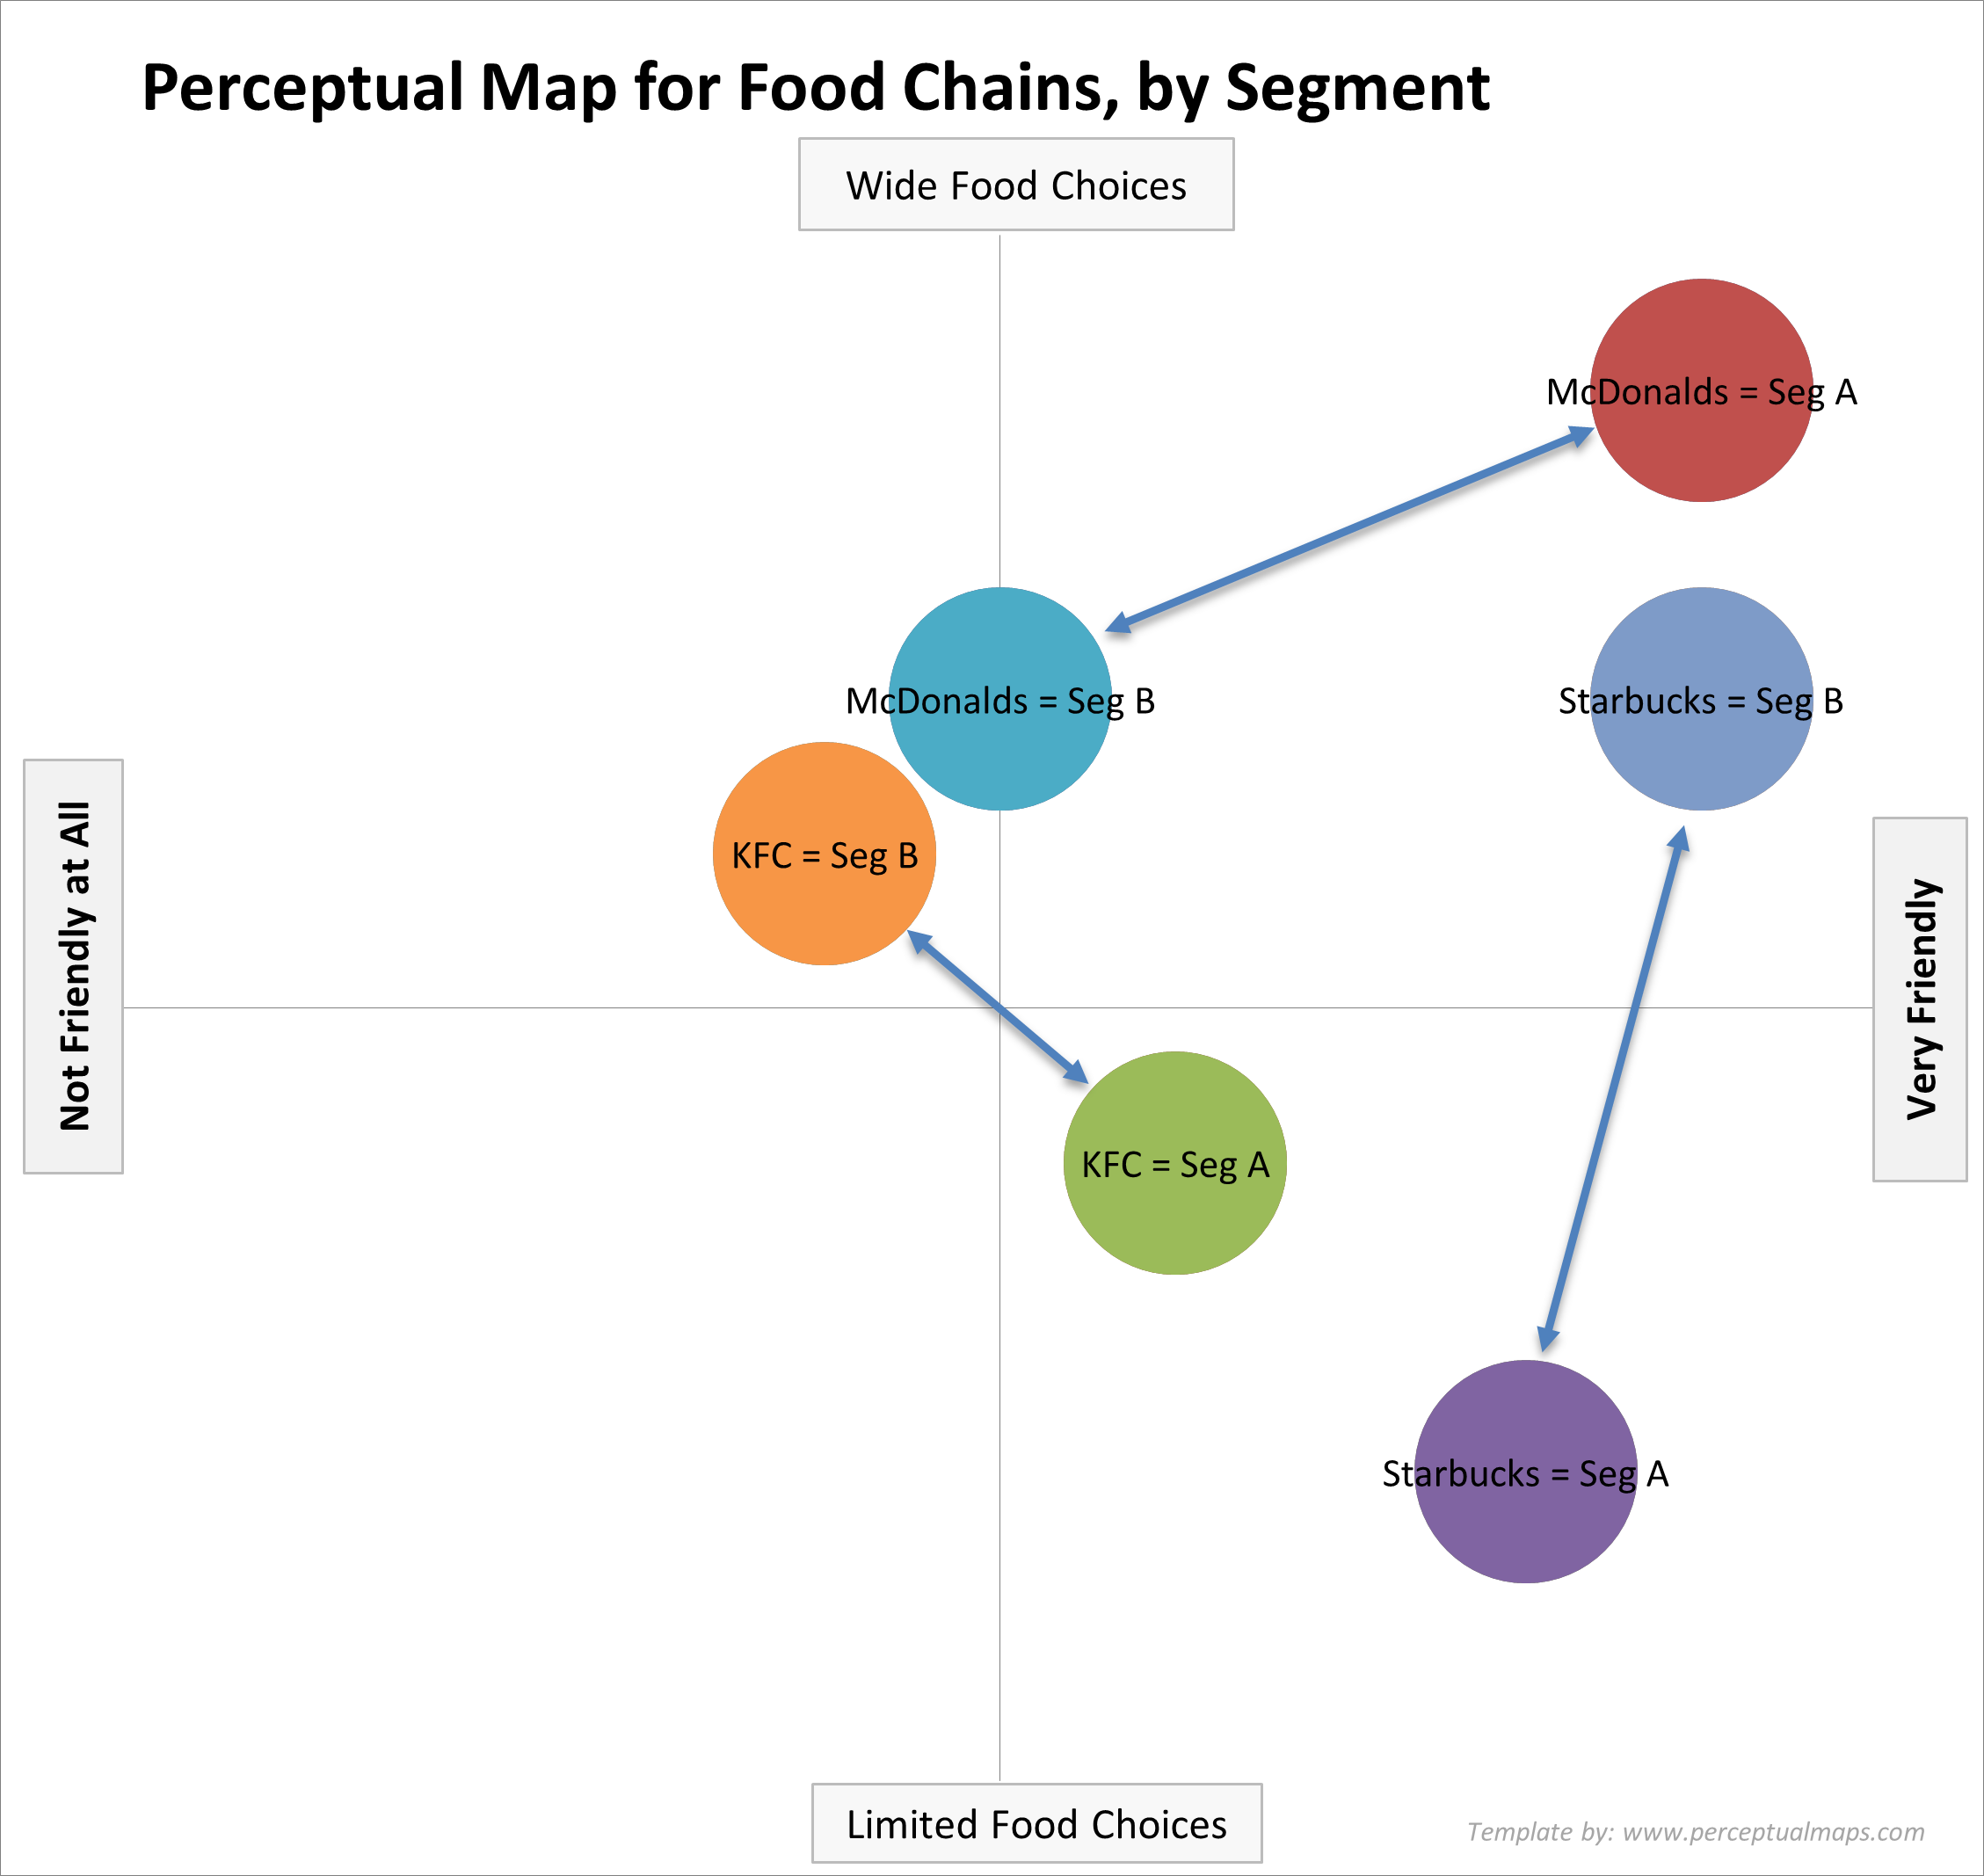
As you can see in the above perceptual map for key fast food chains, the perceptions of two different market segments have been shown and they hold differing understandings of the key players. This is a helpful analytical technique that you can use with perceptual maps, as it uncovers additional market insights.
Please see this external article on Tips on Using Perceptual Maps.
Perceptual versus Positioning Maps
The word ‘perceptual’ comes from the word ‘perception’, which basically refers to the consumers’ understanding of the competing products and their associated attributes, on a relative basis.
In some textbooks, perceptual maps are referred to as positioning maps, but for our purposes they essentially have the same meaning. This is because we are asking consumers about their “perception” of the “positioning” of brands.
The perceptual process is fundamental to understanding how consumers form their perceptions of competing products and brands. It begins with exposure, where consumers encounter marketing messages, product attributes, and competitive comparisons through various touchpoints such as advertising, packaging, and in-store experiences.
Next, attention plays a critical role as consumers focus on specific aspects of the product or brand that stand out to them, such as price, quality, or unique features. These elements are then interpreted based on the consumer’s prior knowledge, experiences, and cultural or personal biases. For example, a luxury watch brand might be perceived as prestigious and high-quality because of its premium pricing and advertisements featuring celebrities.
Finally, these perceptions are compared across competing products to form a relative evaluation. This means consumers assess how one brand positions itself in comparison to others, shaping their overall perception of the brand’s strengths, weaknesses, and unique attributes. This evaluative process is what perceptual and positioning maps aim to visualize, providing marketers with insights into how their brand is perceived relative to competitors.
In summary, perceptual maps serve as a visual representation of this process by illustrating the consumer’s mental framework. They highlight not just individual perceptions but also the relative positioning of competing brands, helping marketers identify market gaps, competitive advantages, and potential areas for repositioning.
FAQs on Perceptual Maps
- What is a perceptual map?
A perceptual map is a visual tool used by marketers to identify the positioning of their products or brands relative to competitors based on consumer perceptions of key attributes. - How is a perceptual map different from a positioning map?
While the terms are often used interchangeably, both perceptual and positioning maps represent consumer perceptions of how brands are positioned in the market. They focus on attributes that are important to consumers and relative positioning among competitors. - What are the key uses of a perceptual map?
Perceptual maps are used for market analysis, trend analysis, competitive strategy development, understanding consumer perceptions, identifying market gaps, and supporting SWOT analysis. - How are perceptual maps created?
Perceptual maps are typically based on consumer survey data, where respondents rate brands on key attributes. These ratings are then plotted on a scatterplot or bubble chart to visualize relative positioning. - Why is consumer perception important in perceptual maps?
Perceptual maps are based on how consumers perceive brands and their attributes, not the actual attributes of the products. This distinction is critical because perception drives consumer behavior and decision-making. - What attributes should be used on a perceptual map?
The axes should represent attributes that are important to consumers, known as determinate attributes, such as quality, price, convenience, or location, depending on the product category. - How can perceptual maps identify market opportunities?
By analyzing gaps on the map, marketers can identify areas where no competitors are currently positioned. These gaps may represent opportunities for new product development or repositioning. - Can perceptual maps analyze different market segments?
Yes, perceptual maps can compare how different market segments perceive brands. This segmentation analysis provides deeper insights into varying consumer preferences and brand strengths. - What is the role of the perceptual process in perceptual mapping?
The perceptual process involves exposure to product information, attention to key attributes, interpretation based on prior knowledge, and relative evaluation of competing brands. This process shapes consumer perceptions and is visualized through perceptual maps. - What are some examples of attributes used in perceptual maps?
Examples include price vs. quality, convenience vs. variety, luxury vs. practicality, and proximity vs. service level. The chosen attributes depend on what drives consumer decisions in the specific market.
Related Articles: For a Deeper Understanding of Perceptual Maps
- Understanding perceptual maps
- Why firms use perceptual maps
- How to interpret maps
- An example for how to interpret a perceptual map
- A step-by-step guide to constructing a map
- Free Perceptual Map Template
- Brand Personas
Check Out this Entire Website Dedicated to Perceptual Maps – Designed for Marketers
For everything you need to know about this important marketing tool, please visit www.perceptualmaps.com